Electronic Technology Forum
Discuss the approximation methods and characteristic analysis of several main low-pass filters
There are three main methods of filter approximation: 1. Butterworth approximation (maximum flat approximation); 2. Chebyshev approximation (equal fluctuation approximation); 3. Elliptic function approximation.
As pointed out above, when implementing various filters, only the low-pass filter can be considered. The other three (high-pass, band-pass, and band-stop) filters can all be transformed according to the network function of the low-pass filter through the corresponding parameter transformation. Obtained, the specific transformation method will be discussed later. When considering the network function of the low-pass filter, the pass-band cut-off frequency ωc of different low-pass filters may be different, but for the convenience of discussion, the frequency variable ω is transformed according to the scale of the usual cut-off frequency ωc, Take the normalized frequency of Ω=ω/ωc for approximation. For the normalized frequency Ω, the passband cut-off frequency of all low-pass filters will all become 1.
The approximate methods of several main low-pass filters are discussed below.
1. Butterworth approximation
The amplitude-frequency relationship of Butterworth low-pass filter is

Where Ω is the normalized frequency, that is, Ω=ω/ωc; H(0) is the amplitude when Ω=0.
From equation (5.1-2), it can be seen that the amplitude-frequency function |H(jΩ)| will decrease monotonously with the increase of the normalized whisker rate|. When Ω=0, |H(j0)|=H(0) is the maximum value, when Ω=1, |H(jΩ)|=H(0)/
, That is, it drops by 3 decibels, and then gradually tends to zero with the increase of Ω. For the Butterworth approximation, its passband attenuation is 3 decibels, independent of the order n. As the order n increases, the amplitude-frequency response is closer to the amplitude-frequency characteristics of an ideal filter. Figure 5.1-2 shows the approximate amplitude-frequency characteristics of Butterworth when n=2.5.10, and H(0)=1 in the figure.
It can be seen from the formula (5.1-2) that when Ω>1, its amplitude will decrease at a rate of -20ndB/10 octave. According to the attenuation of As decibels for a certain stopband frequency Ωs, the Butterworth order n is

For example, when Qs=2, the required attenuation As is greater than 40 decibels, then according to the above formula

Take n=7, that is, the order of the Butterworth low-pass filter is n=7 to meet the requirement that the stop-band attenuation is greater than 40 decibels when Ωs=2. Obviously, for a certain normalized angular frequency Ω (greater than 1), the greater the attenuation As, the greater the required order n. Conversely, for a given stopband attenuation As, the closer the Qs is to 1, the greater the order n.
In order to obtain the network function H(S) of the Butterworth low-pass filter, the equation (5.1-2) can be written as

Changing the jΩ of the above formula into a complex variable S, then Ω2=-S2, and substituting the S variable into the above formula, we can get (set H(0)=1)

(5.1-5) The formula has 2n poles, which can be obtained by the following formula:

It can be seen from this formula that 2n poles are distributed on the unit circle of the S plane, and the left and right planes are symmetrical. In order to meet the achievable condition, the pole of the left half plane can be considered as the pole of H(S). According to equation (5.1-6), the pole of the left plane can be written as

Therefore, the network function of the Butterworth low-pass filter is (see Reference (32))

For convenience, the above formula can be written as:
When n is an even number,

and

When n is an odd number,

and


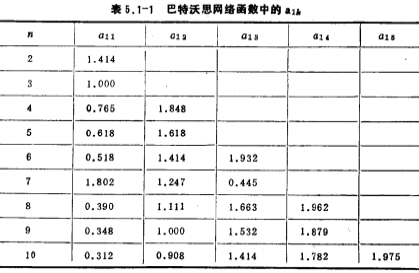
It can be obtained by (5.1-10), (5.1-11) and (5.1-13), (5.1-14) . Table 5.1-1 lists n from 2 to 10
 value. according to
  value, you can directly write the network function H(S) of the Butterworth low-pass filter with n from 2 to 10.
For example, n=5, a11=0.618, a12=1.618, from the formula (5.1-12)

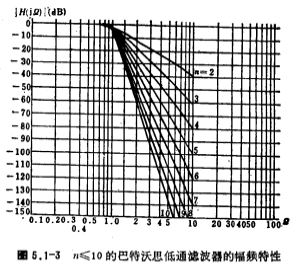
The amplitude-frequency characteristics of Butterworth low-pass filter with n≤10 are shown in Figure 5.1-3. The angular frequency coordinate in the figure is the normalized angular frequency Ω, and H(0) is equal to 0 decibels.
2. Chebyshev approximation
Butterworth approximation has good amplitude-frequency characteristics at Ω=0, but when Ω is large (that is, when Q=1), there is an error of 3 decibels. At the same time, in the stop band (Ω>1), the amplitude is The attenuation rate is not very fast (for a certain value of n), so the Chebyshev approximation is used for this purpose. Since this approximation has equal fluctuation characteristics in the pass band, this approximation is called equal fluctuation approximation. The amplitude-frequency response of the Chebyshev low-pass filter is

In the formula, the normalized frequency Ω=ω/ωc, and ωc is the width of the passband fluctuation; Ho is the amplitude when Ω=0; ε is the quantity related to the passband fluctuation, and its value is less than 1; (Ω) is the Chebyshev polynomial.
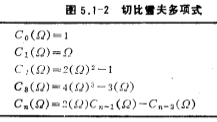
The Chebyshev polynomial is defined as follows:

From the formula (5.1-16), the expression of image.png (Ω) is obtained, as shown in Table 5.1-2.
Chebyshev polynomials have the following characteristics:
(1) In the range of Q≤1, the function value (Ω) fluctuates, but its absolute amplitude does not exceed 1, that is ▏
 (Ω)▏≤1。
(2) When Ω>1, then ▏ (Ω)▏will increase rapidly as Ω increases.
It can be seen from equation (5.1-15) that when Ω≤1, because ∈<1, ,therefore
 It only fluctuates below Ho, the smaller ∈, the smaller the fluctuation, but when Ω>1, and
 ,So
,So the larger "1, n is, the faster it decreases. Figure 5.1-4 shows the approximate amplitude-frequency characteristics of Chebyshev when n is 2, 5, and 10 for a certain ε value.
It can be seen from Figure 5.1-4 that the passband has equal fluctuation properties, and the maximum attenuation value R in the passband is related to ε (see Reference (32))

The number of fluctuations in the passband will be determined by the approximate order n. The larger the n, the more the fluctuations, but at Ω=1, no matter how large n is, the attenuation value is the same, which is equal to . When Ω>1, the amplitude decrease rate is faster than Butterworth's approximation. If the order n is the same, then
 the larger the decay rate of the stop band is, the faster.
Regarding the order n of the approximation function, similar to the Butterworth approximation, it will be determined by the stopband frequency Ωs when the filter reaches the stopband attenuation As (decibel), and the relationship can be determined by (5.1-15). Set Ho=1, the stopband attenuation value As=1/▏H(jΩs)▕, that is

When Ω is large, ,And according to
 the recurrence relation (see Table 5.1-2) can be deduced
 The highest order term of Ω in the polynomial will be
 , If only the highest degree term is retained in the polynomial, then the formula (5.1-18) can be approximated as

From the above formula

[Example 1] Design a low-pass filter, the passband fluctuates Decibels, and when Ωs=2, the stopband attenuation value As≥
40 decibels, try to find the Chebyshev approximation order n.
From the formula (6.1-17a)

From the formula (5.1-19)

According to the previous calculations, under the condition of stopband attenuation As≥40dB, if the Butterworth approximation is used, the order n is 7. Obviously, the Chebyshev approximation attenuates faster in the stopband than the Butterworth approximation. Therefore, people often use the Chebylev approximation.
In order to obtain the network function H(S) approximated by Chebyshev, substituting S=jΩ into the formula (5.1-15),

The pole of H(S) can be obtained from the above formula, set the pole after certain mathematical processing,
 They are represented by the following formulas (see Reference (32)):

where

Calculate then, the normalized Chebyshev network function H(S) is expressed as

where

H0 is the value obtained when H(0)=1. Expanding the denominator of formula (5.1-22), H(S) can be written as:
When n is an even number,

When n is an odd number,

Assume for
for the common pole of
 Then (5.1-23), (5.1-24) in the formula
and The relationship with the pole is

(5.1-24) where Is the real pole of the network function.
The poles of the Butterworth network function H(S) are distributed on a circle with a radius of 1, while the poles of the Chebyshev network function H(S) are distributed on the corresponding ellipse, and their distribution angles are all the same .
[Example 2] Design a low-pass filter, requiring fluctuations in the passband decibel, stop band frequency
 time stopband attenuation As≥40dB.
From the formula (5.1-17a)

From the formula (5.1-19), the order n=4.
For simplicity, formula (5.1-21a, b) is rewritten as

where

Substitute the value of ∈ the relation is

will substitute the value into (5.1-21a, b) to get
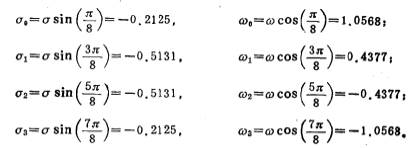
Therefore, the poles of the Chebyshev network function are
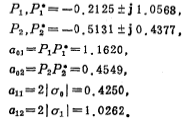
From the formula (5.1-23), the normalized Chebyshev network function H(S) is

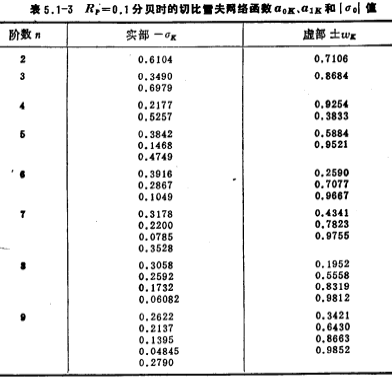
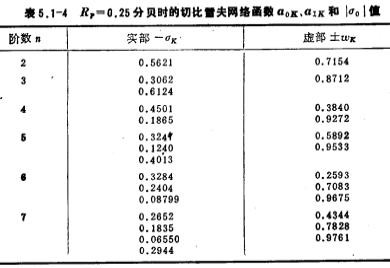
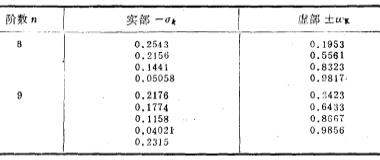
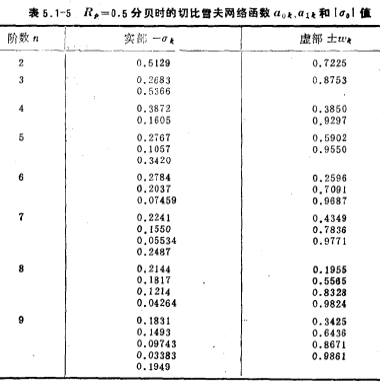
Table 5.1-3~5 respectively show the passband fluctuation Chebyshev network function at 0.1 decibel, 0.25 decibel and 0.5 decibel
 , the real pole in the table is
 ).
).
3. Elliptic function approximation
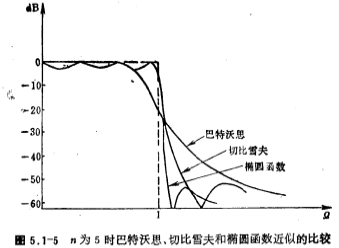
The Butterworth and Chebyshev network function H(S) discussed earlier is an all-pole network function without zeros. The elliptic function approximation discussed here has both poles and zeros. It is similar to Chebyshev in the passband part and has equal fluctuation characteristics. When the frequency is greater than the cutoff frequency of the passband (Ω=1), its amplitude attenuation rate is approximately faster than that of Chebyshev, but the stopband attenuation is not monotonous. , Also has the characteristics of equal fluctuations. In order to facilitate comparison, Figure 5.1-5 shows three approximate amplitude-frequency characteristics. For these three types of curves, the order (pole) n is equal to 5, and the Chebyshev passband fluctuates . decibel. Elliptic function passband fluctuation
 decibels, and the elliptic function approximately has two zeros.
The amplitude and whisker curve of the normalized elliptic function is shown in Figure 5.1-6. The parameters in the figure are defined as follows;
 =Passband fluctuation (approximately the same as Chebyshev), the unit is decibels.
 =The minimum attenuation of the stop band, in decibels.
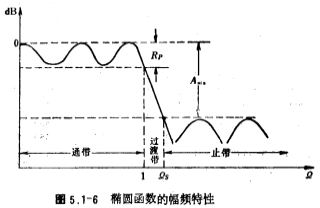
Ω1 is the attenuation at the stop band the lowest stop-band frequency at the time, usually called the stop-band frequency of the ellipse approximation. The width of the passband and other fluctuations is the cutoff frequency of the passband, that is, Ω1, the zone where Ω goes from 1→Ω1, is called the transition zone.
The calculation of the network function H(S) of the elliptic function approximation is very complicated and will not be discussed here. Now only the expression and parameter table are given for design use.
The normalized network function /H(S) of the elliptic function approximation is

In the formula and
and depend on
 and stop band frequency
 decided.
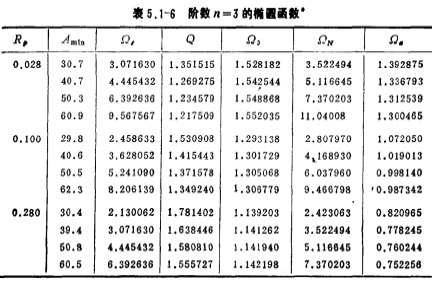
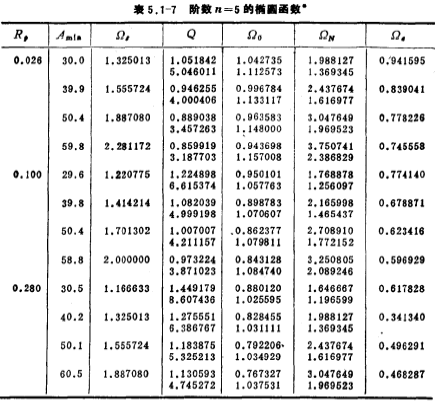
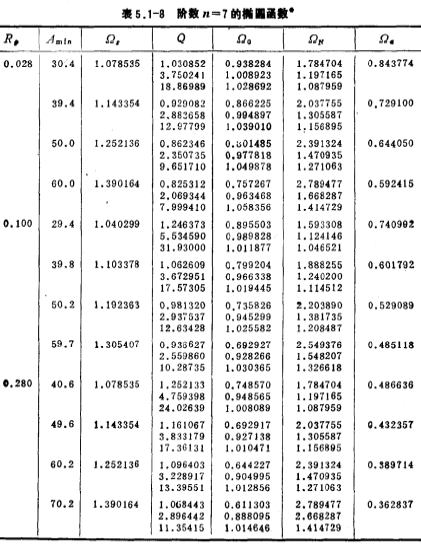
Table 5.1-6~Table 5.1-8 give the normalized comb function H(S) when n=3, 5, and 7, respectively. The parameters in the table are the same as those in (5.1-27) and (5.1-28) and
and the relationship is as follows:
 。
。



Contact: Mr. Zou
Contact number: 0755-83888366-8022
Mobile phone: 18123972950
QQ: 2880195519
Contact Address: 5C1, Block CD, Tianji Building, Tianan Digital City, Chegongmiao, Futian District, Shenzhen
Please search WeChat official account: "KIA Semiconductor" or scan the following picture to "Follow" official WeChat official account
Please "follow" the official WeChat account: provide MOS tube technical assistance


